-
Enterprise Reporting Capabilities
-
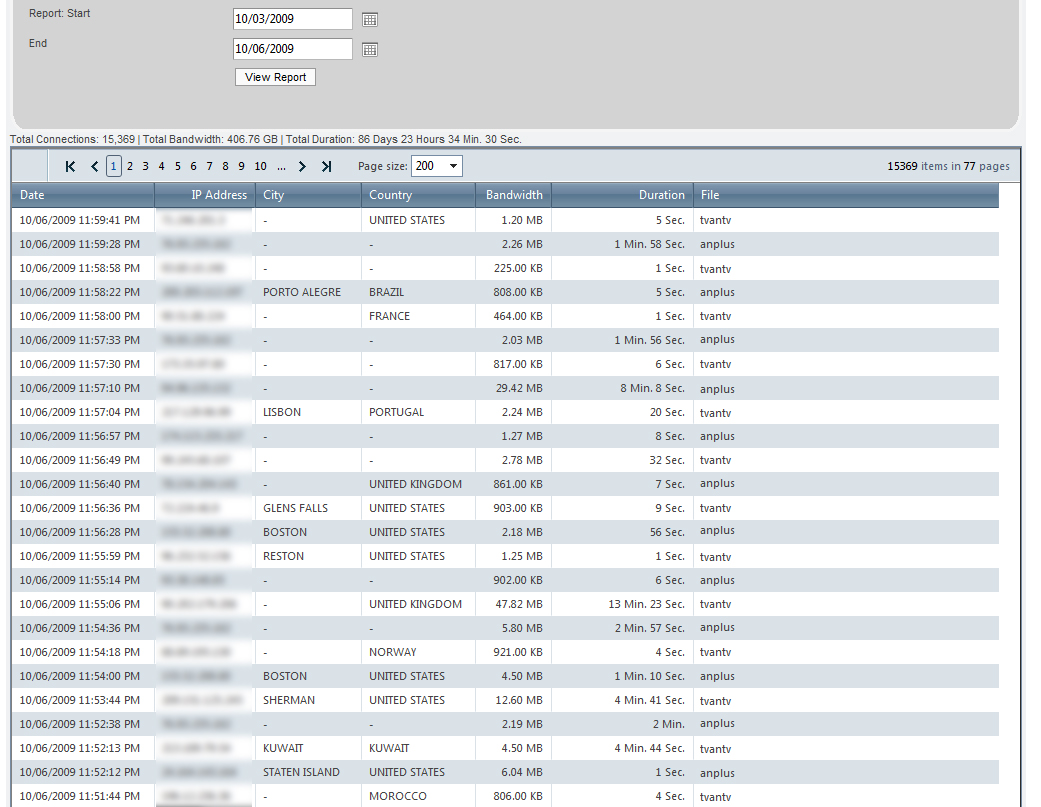
Duration Per Connection – 3 Months
-
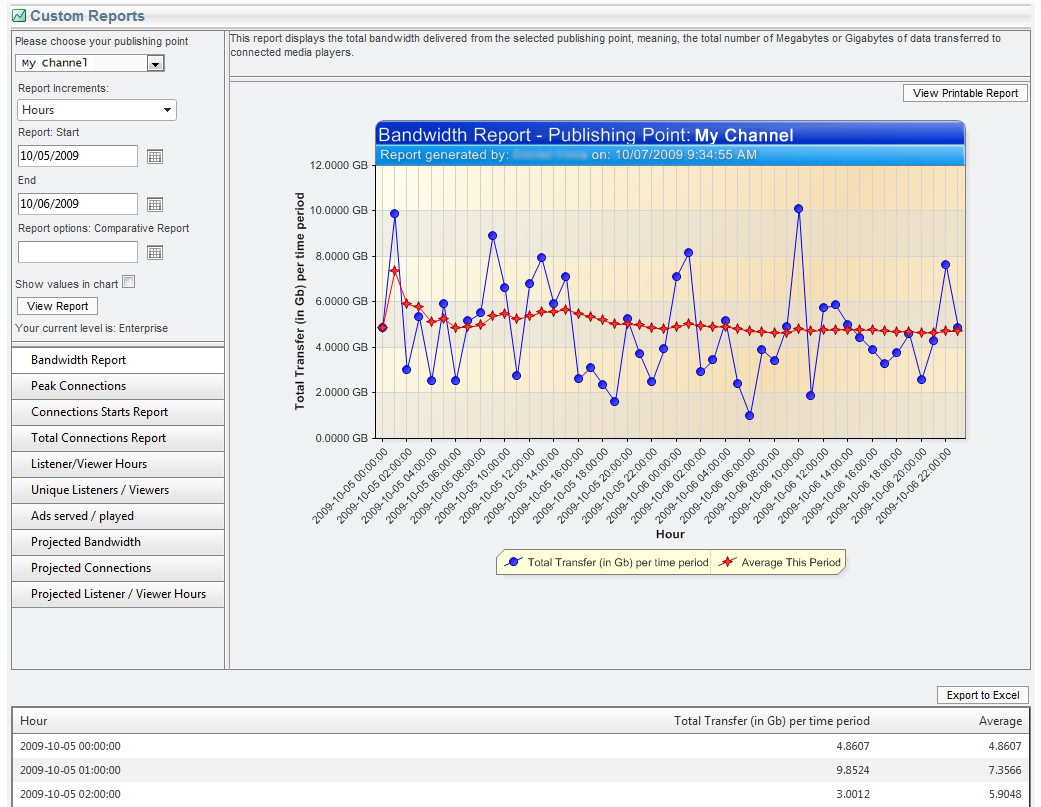
Hourly Bandwidth Usage
-
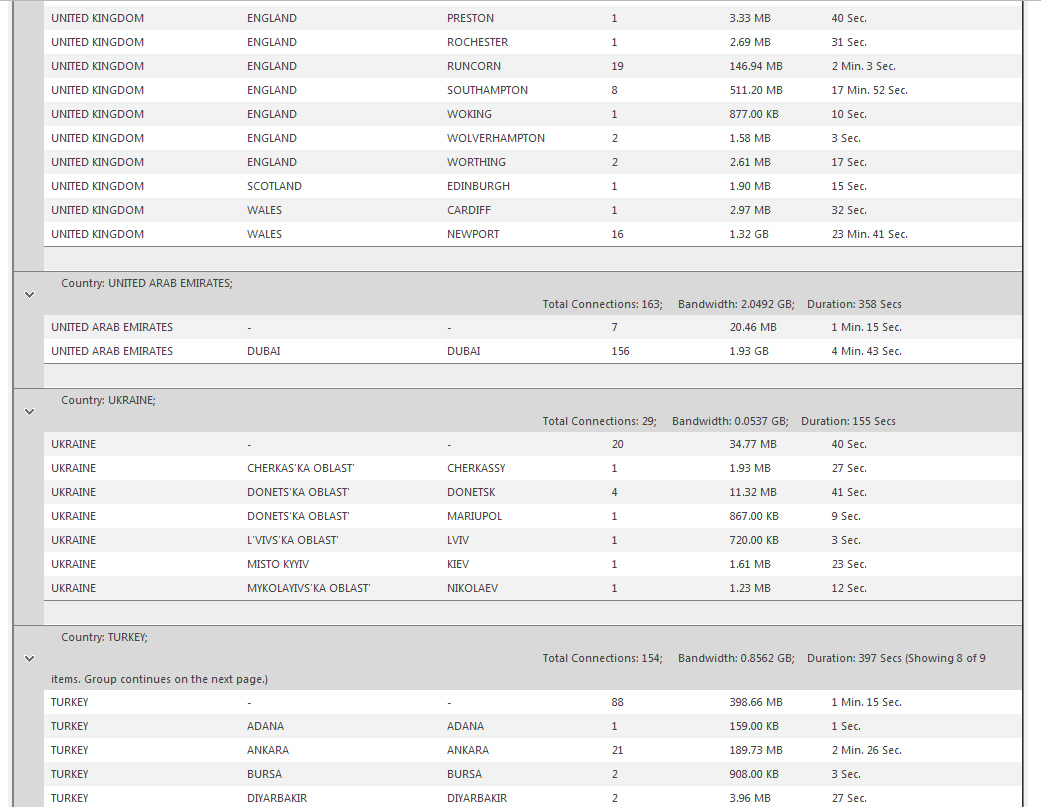
Geographic Usage Overview
-
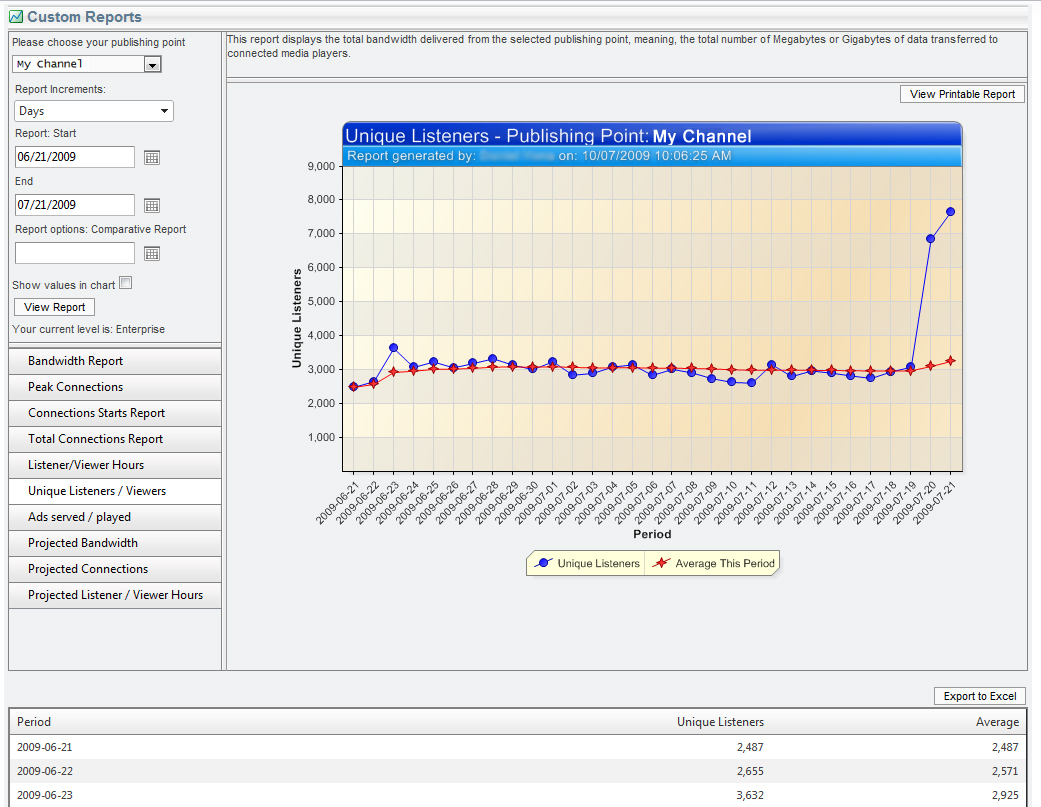
Unique Users – 1 month
-
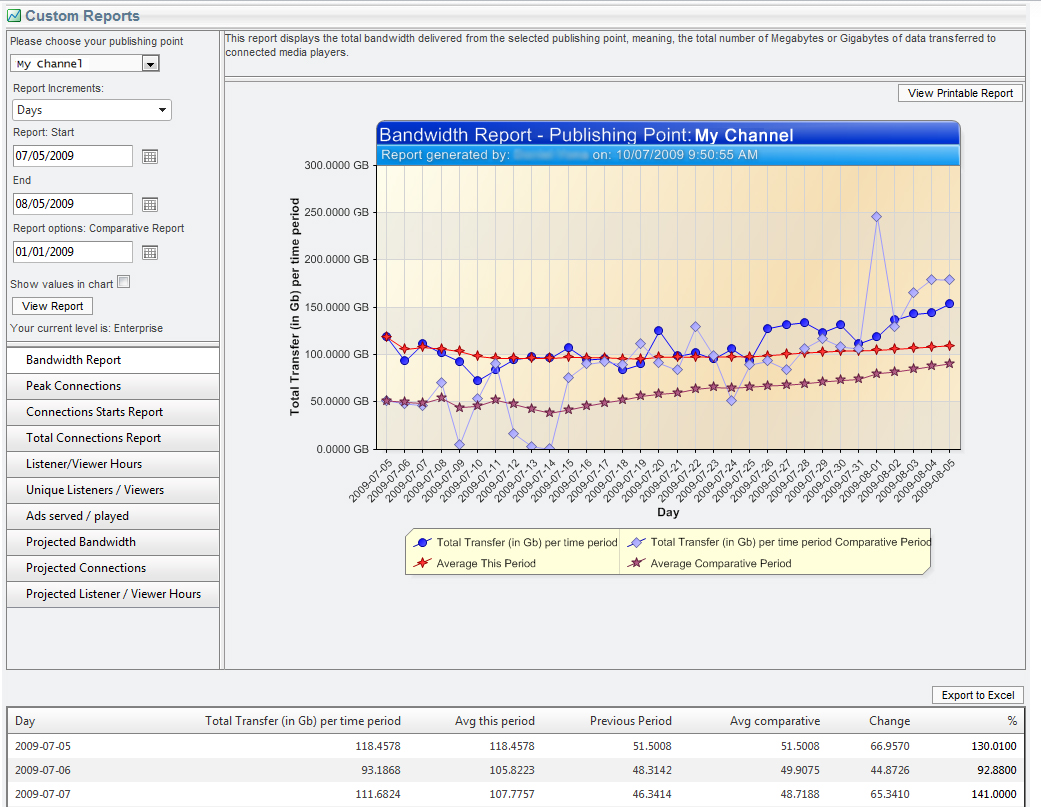
Projected Bandwidth Usage
NetroMedia Reporting Tools:
NetroMedia offers you four different levels of reporting tools, ranging from Free to Enterprise-class reporting, allowing you to track viewer / listener stream usage using numerous parameters, analyze the effectiveness of your streaming project(s) and spot crucial viewer / listener trends over time.
- Reports are generated in real-time: Get your statistics whenever you want through our streaming portal (NetroPortal).
- Potential advertisers will love the amount of statistics you’ll be able to offer them about your stream’s audience.
- As an experienced CDN and streaming provider, we know the success of a project does not end with the stream’s delivery. Our reporting tools provide you with answers to critical questions and relevant information to improve your stream’s performance.
- Measure the effectiveness of your advertising campaigns, and learn all you can about your audience’s viewing / listening habits.
Professional and Enterprise Level reporting are an essential add-on for broadcasters who wish to maximize their stream’s performance and create a successful streaming environment for both users and advertisers, while gaining access to a wide range of statistics that are on any broadcaster’s wish list.
+ Reporting Levels
| Free $0 | Basic $25 | Professional $75 | Enterprise $125 |
| Free Range: 14 Days Real-Time Statistics Full Geo-Reports Printable Charts |
Basic Range: 30 Days Real-Time Statistics Full Geo-Reports Printable Charts Peak Connections |
Professional Range: 1 Year Real-Time Statistics Full Geo-Reports Printable Charts Peak Connections Most Popular Times |
Enterprise Range: 1 Year Real-Time Statistics Full Geo-Reports Printable Charts Peak Connections Most Popular Times Project Statistics |
Enterprise Reporting
As a broadcaster, Enterprise Level Reporting gives you all the statistics and analytical tools needed to make informative decisions about your streaming projects. Regardless of whether your project involves live streaming or on-demand streaming – knowing who your audience is, and how they view your stream – is crucial for the project’s overall success.
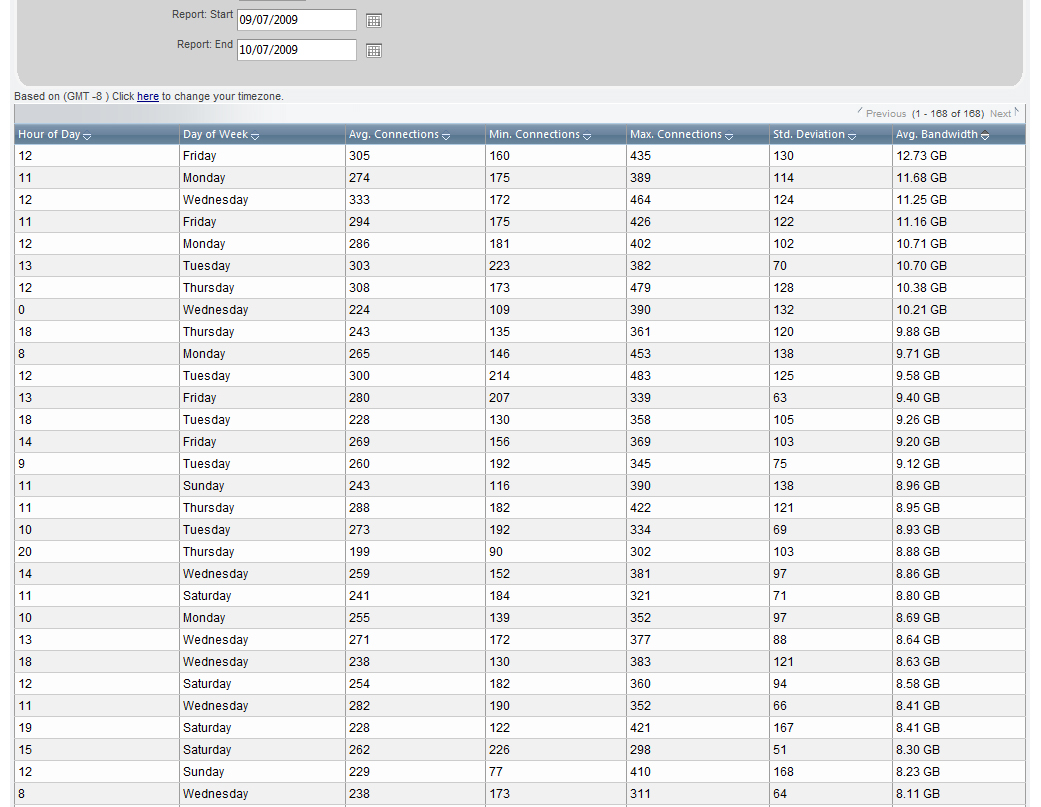
Most Popular Times
Measure your stream’s overall populartiy. This report produces a list of your stream’s most popular times: Groupable by Day, Hour, Average Bandwidth, Maximum Connections, Minimum Connections and Standard Deviation.
Total Connections
Get an overview of your stream’s total connections based on the time period you specify, in the form of a graph or in a detailed list. Find out, for example, how your stream performs every day of the month, against the average of the selected period.
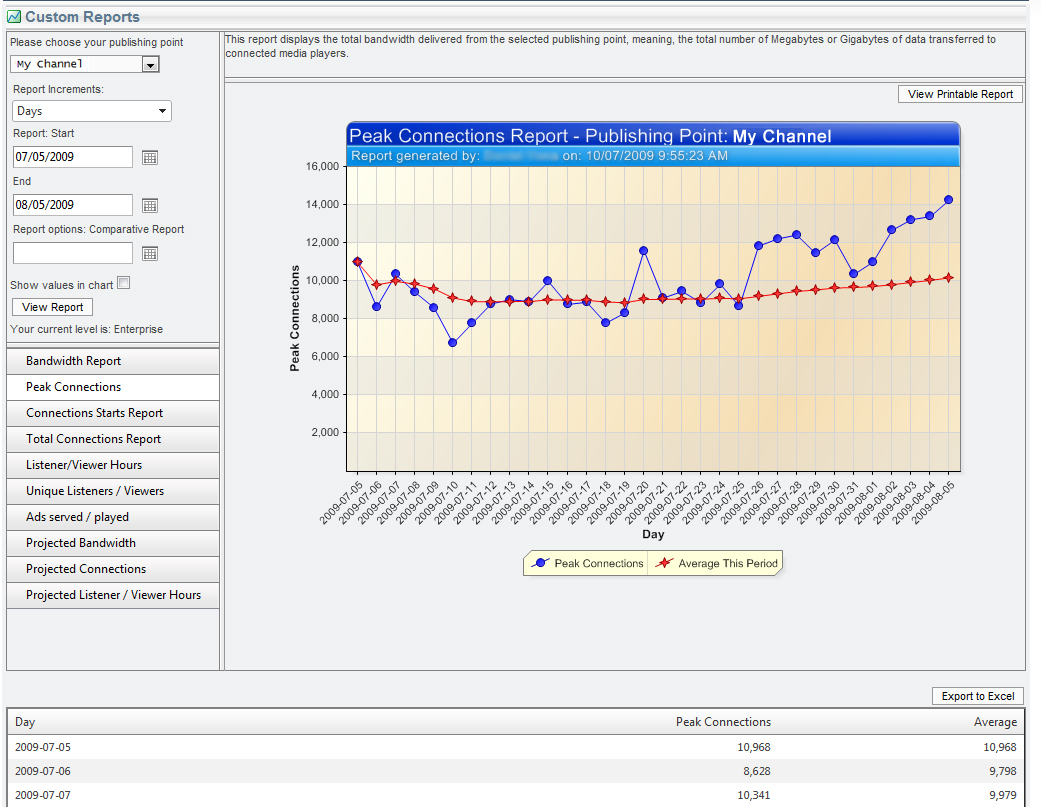
Peak Connections
What is the highest number of concurrent viewers / listeners your stream attracted at a single point in time? How does it compare to the average of that period? This report gives you a broad perspective on the success of your streaming project, measureable in different time-frames.
Geographic Overview
Find out exactly where in the world your stream is most popular (cities, states and countries). Regardless of whether you’re a global or local broadcaster, knowing where your stream arrives after it leaves our servers is powerful knowledge you can use to fine-tune your project goals.
Most Popular Times
Total Connections
Peak Connections
Geographic Overviews